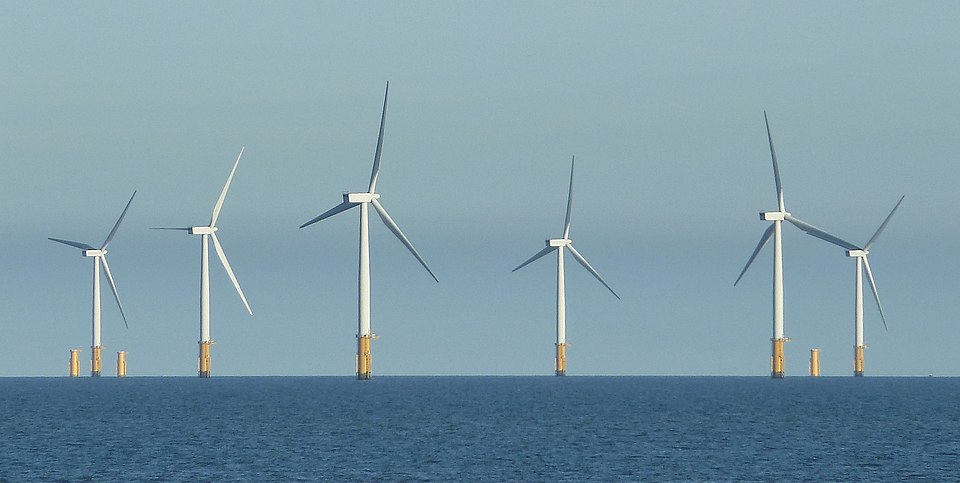
New Uswitch analysis of government data has revealed the UK’s top-performing local authorities for renewable energy generation per household, with Moray in Scotland emerging as the national leader.
Moray leads the UK with 47.4 MW per 1,000 households, followed by North East Lincolnshire at 41.4 MW. Other notable regions include Boston (32.0 MW), East Lothian (27.3 MW), and Highland (26.3 MW).
Scottish local authorities rank highly, reflecting a mix of strong investment and favourable conditions for wind power, such as higher wind speeds and suitable terrain. The data highlights how both geography and different local approaches play a role in shaping the UK’s renewable energy landscape.
Areas with the most solar and wind power
The UK regions with the highest solar, onshore, and offshore wind capacity per household (excluding other renewable sources due to data limitations) are as follows.
Solar photovoltaics: East Cambridgeshire leads with 4.4 MW per 1,000 households, followed by South Cambridgeshire (4.3 MW). Pembrokeshire and Torridge each generate 4.0 MW, with several rural areas making strong gains in solar capacity.
Onshore wind: Highland tops the list with 18.3 MW per 1,000 households, followed by Dumfries and Galloway (13.1 MW) and South Ayrshire (12.7 MW), showcasing Scotland’s dominance in wind energy.
Offshore wind: North East Lincolnshire leads with 40.4 MW per 1,000 homes, followed by Moray at 35.0 MW. Other key contributors include Boston and East Lothian, highlighting the importance of coastal regions in offshore wind generation. North East Lincolnshire’s growth is driven by major projects like the Hornsea Wind Farm series, Hornsea One and Two, with capacities of 1.2 GW and 1.4 GW respectively. They are the largest offshore wind farms in the world as part of Ørsted’s East Coast Hub in Grimsby.
North East Lincolnshire leads with a 1,017% growth in renewable energy capacity from 2018 to 2023, followed by Boston (985%) and East Lothian (734%). Urban areas like Sutton, Hammersmith and Fulham, and Barnet also show substantial increases, reflecting rapid growth in both rural and urban renewable energy generation.
To conduct the research, Uswitch took UK government data on renewable energy generation for the last 10 years and used it to calculate:
● The overall change in renewable capacity from 2014-2023.
● The top local authorities by renewable capacity (2023)
● The top local authorities by increase/decrease in renewable capacity (2018-2023)
● The biggest types of renewable energy generation in the UK by capacity (2023)
● The local authorities with the most solar and wind capacity (2023)
Where local authority changes had taken place in the period covered, data from the old authorities was grouped into the relevant new authority to allow for comparisons.
For more from Uswitch, click here.


